BALTIMORE (Stockpickr) -- A handful of REITs are setting up for big moves this August.
While most investors have been fixated on the stock market's climb in 2013, many market participants haven't noticed the roller coaster ride that real estate investment trusts (better known as REITs) have seen this year.
REITs started out the year as a favorite asset class, but things took a turn at the end of May as real estate-linked assets corrected much harder than stocks. As I write, the SPDR Dow Jones REIT ETF (RWR), for instance, is only up 6.8% year to date -- compare that with the 18% rally in the S&P 500.
Despite that underperformance, as a group, REITs are showing far more technical diversity than any other sector -- and that means that there are trades to be made right now. That's why we're taking a technical look at the trading setups brewing in five REITstoday.
For the unfamiliar, technical analysis is a way for investors to quantify qualitative factors, such as investor psychology, based on a stock's price action and trends. Once the domain of cloistered trading teams on Wall Street, technicals can help top traders make consistently profitable trades and can aid fundamental investors in better planning their stock execution.
So, without further ado, let's take a look at five technical setups worth trading now.
Extra Space Storage
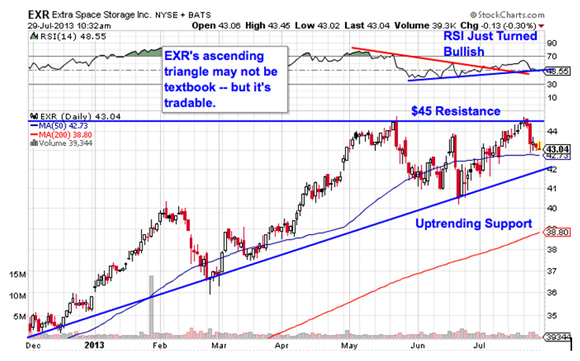
Up first is Extra Space Storage (EXR), a $5 billion self-storage facility owner. EXR has posted strong performance for 2013, rallying close to 19% since the calendar flipped over to January. That's more or less on par with the performance of the S&P, but it's a whole lot stronger than most REITs. That outsized relative strength looks ready to carry over to the second half of the year.
That's because EXR is currently forming an ascending triangle pattern, a price setup that's formed by a horizontal resistance level to the upside and uptrending support to the downside. Essentially, as shares of EXR bounce in between those two technical levels, they're getting squeezed closer and closer to a breakout above resistance -- at $45 in this case. When that breakout happens, traders have a buy signal in shares.
EXR's pattern isn't exactly textbook, but that doesn't change the trading implications in this stock. Momentum adds some extra confidence to EXR's ability to break out; 14-day RSI turned bullish just last week. After EXR clears $45, keep a tight protective stop in place.
Pebblebrook Hotel Trust
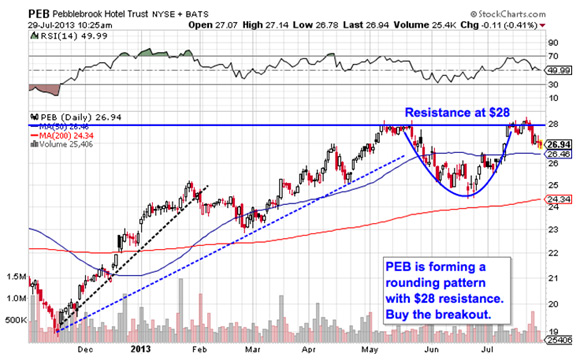
Small-cap hotel investment REIT Pebblebrook Hotel Trust (PEB) is setting up a similar pattern to the one in EXR -- with a few exceptions.
PEB isn't forming an ascending triangle; support isn't in the same sort of uptrend in this stock. Instead, PEB is forming a rounding pattern with resistance at $28. Rounding patterns look just like they sound -- they indicate a shift in control from sellers to buyers. While this setup is most common as a "bottoming" pattern, PEB's price action doesn't change the implications if shares can break out above $28. That's our buy signal.
Whenever you're looking at any technical price pattern, it's critical to think in terms of buyers and sellers. Triangles, rectangles and other price pattern names are a good quick way to explain what's going on in this stock, but they're not the reason it's tradable. Instead, it all comes down to supply and demand for shares.
That resistance line at $28 is a price where there's an excess of supply of shares; in other words, it's a place where sellers have been more eager to take recent gains and sell their shares than buyers have been to buy. That's what makes the move above it so significant -- a breakout indicates that buyers are finally strong enough to absorb all of the excess supply above that price level. Wait for that signal to happen before you jump into this stock.
Newcastle Investment
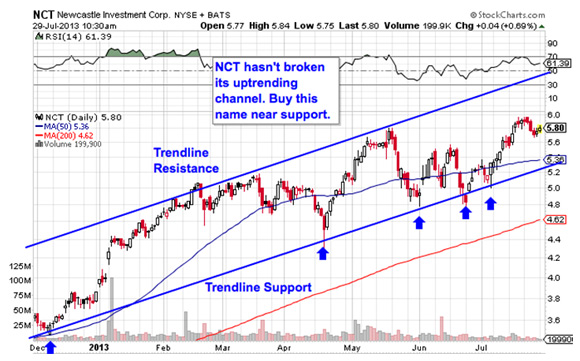
You don't have to be an expert technical analyst to figure out what's going on in shares of Newcastle Investment (NCT) -- a quick glance at the chart will do. NCT has been in an uptrend since the end of December, rallying as it got pushed by tailwinds in the real estate sector and then spun off its residential financing unit into New Residential Investment (NRZ) in May.
Adjusting shares of NCT for the spinoff gives us the chart above.
As you might expect, the best time to be a buyer in NCT is on a bounce off of support. Buying off a support bounce makes sense for two big reasons: It's the spot where shares have the furthest to move up before they hit resistance, and it's the spot where the risk is the least (because shares have the least room to move lower before you know you're wrong).
The fact that NCT has managed to clear its previous swing high from May speaks volumes about this stock's relative strength right now. Historically, high relative strength tends to continue to outperform the market for another three to 10 months. That puts NCT owners in a good position for the second part of 2013.
MFA Financial
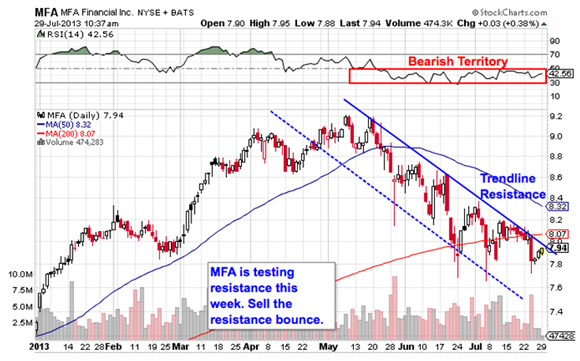
We're seeing the exact opposite setup in shares of MFA Financial (MFA). Unlike NCT, shares of MFA have been in a well-defined downtrend since the middle of May. That high probability range puts this stock's likely target price lower for the end of August.
Since the best time to buy an uptrend is at support, it makes sense that the best time to sell a stock in a downtrend is at trendline resistance. That's the exact level that MFA is testing this week. If you own MFA right now, it makes sense to be a seller on the first semblance of a bounce lower.
Momentum provides some extra confirmation here too. RSI has been suck down in bearish territory since the uptrend began in May. Oscillators like RSI tend to become range-bound when stocks' price action trends. I'd look for a move above 50 on RSI as a precondition to a move higher in price.
Retail Properties of America
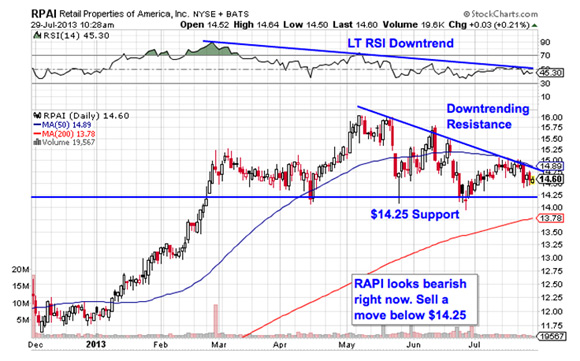
Last up is Retail Properties of America (RPAI), a $4 billion trust that owns and operates shopping centers. RPAI is another bearish setup right now -- shares are currently forming a descending triangle, the opposite of the bullish setup we looked at in EXR. Here's how to trade it.
The descending triangle is a price setup that's formed by horizontal support -- in this case at $14.25 -- and downtrending resistance. As shares get squeezed closer to that support level at $14.25, the probability is increasing that we'll see a breakdown below support. When that happens, it makes sense to sell (or short) shares. If you decide on the latter, it makes sense to keep a protective stop on the other side of the 50-day moving average -- it's acted as a decent proxy for resistance over the course of this setup.
Don't be early on this trade. The broad market is still in a primary uptrend, and that makes any shorts counter-trend trades right now. RPAI doesn't become a high probability downside name until that excess demand at $14.25 gets absorbed by sellers.
To see this week's trades in action, check out the Technical Setups for the Week portfolio on Stockpickr.
-- Written by Jonas Elmerraji in Baltimore.
No comments :
Post a Comment