BALTIMORE (Stockpickr) -- Has the market already topped? Well, only in the most literal sense.
Ongoing conflict in Syria is spooking the stock market this week, as Wall Street worries about the possibility that the U.S. will get involved in the action. Stocks fell hard on Tuesday, after Secretary of State John Kerry spoke to the media about the possibility of military response to gas attacks in the country. Yesterday's rebound barely made a dent in getting the big indexes out of the red.
But while U.S. equities are in make-or-break mode again this week, it's a bit early to call it a top. Let's not forget that the S&P 500 is a mere 4.4% off of all-time highs now -- and the big index still higher today than it was anytime up until this summer.
Nope, a crash this isn't.
But the increased anxiety is creating some tradable opportunities right now. Today, we're taking a technical look at five of them.
If you're new to technical analysis, here's the executive summary.
Technicals are a study of the market itself. Since the market is ultimately the only mechanism that determines a stock's price, technical analysis is a valuable tool even in the roughest of trading conditions. Technical charts are used every day by proprietary trading floors, Wall Street's biggest financial firms, and individual investors to get an edge on the market. And research shows that skilled technical traders can bank gains as much as 90% of the time.
Every week, I take an in-depth look at big names that are telling important technical stories. Here's this week's look at five high-volume stocks to trade this week.
SPDR S&P 500 ETF
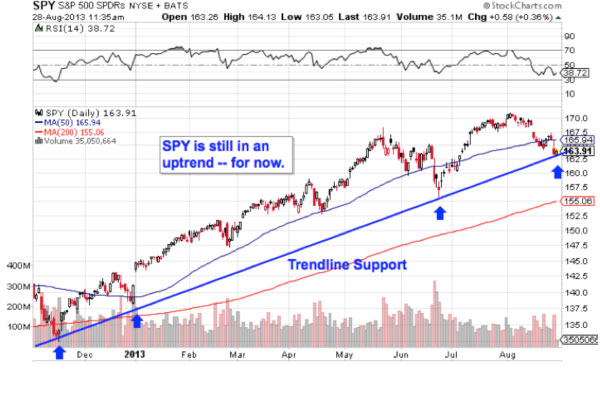
Up first, it makes sense to take a look at the SPDR S&P 500 ETF (SPY). After all, SPY is the most investible proxy for the S&P 500 index -- and one of the best way to "buy stocks" in general. A quick look at the chart should tell you everything you need to know about this stock. You don't have to be an expert technical analyst to see that SPY is still in an uptrend.
Even though the uptrend in stocks got shifted lower with June's correction, the trendline connecting this rally's lows is very well defined right now -- and it's getting tested this week. A breakdown below trendline support would be a very negative signal for stocks in the intermediate term. But as of yet, it hasn't happened. In fact, tests of trendline support have historically been the optimal time to buy shares on the way up. So with SPY testing its price floor again now, it makes sense to buy early signs of a bounce.
Buying off a support bounce makes sense for two big reasons: It's the spot where shares have the furthest to move up before they hit resistance, and it's the spot where the risk is the least (because shares have the least room to move lower before you know you're wrong).
The bottom line is this: It's still way too early to turn bearish on this market.
Chevron
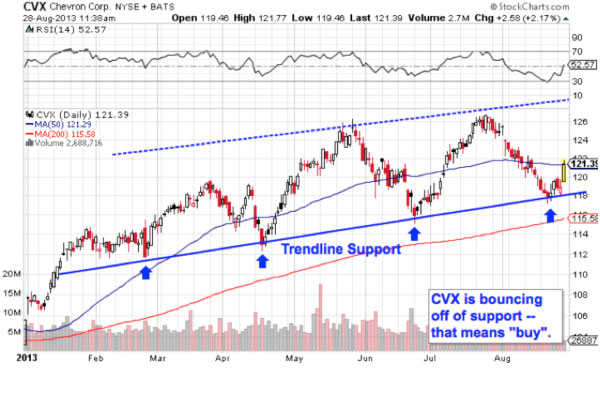
Surprisingly, one of the names that's correlating the highest with the S&P 500 right now is oil and gas supermajor Chevron (CVX). Just like the S&P, Chevron is trading in a very well-defined trend channel. The key difference is that the Chevron trade is further along; this stock is bouncing off of trendline support this week. That means it's time to be a buyer.
Commodities and materials stocks are seeing some buoyancy this week, but Chevron's price action is different -- it's been more sustained over the course of 2013. This stock's proximity to trendline support right now makes it the best-in-breed oil name in my view. As geopolitical risks propel oil prices, the real story at CVX is the fact that support is just a few points away. That makes Chevron a great setup from a risk management perspective.
Speaking of risk management, if you decide to jump into shares here, I'd recommend keeping a protective stopprotective stop just above the 200-day moving average.
Wal-Mart
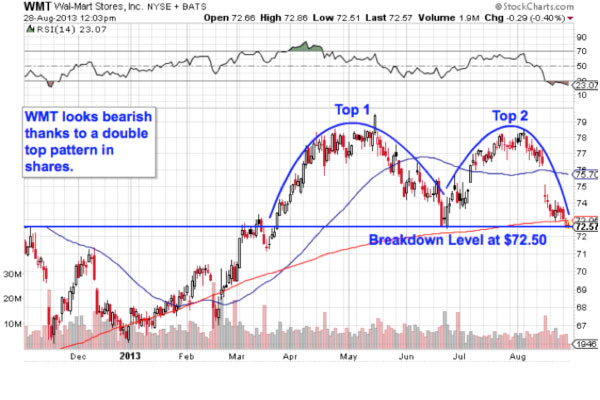
Not all blue chip names look quite as bullish right now -- take Wal-Mart (WMT). The retail behemoth looks downright "toppy" thanks to a long-term bearish setup that's been playing out in shares. Now, this stock is very close to triggering a sell (or short) signal for traders.
Wal-Mart is currently forming a double top, a price setup that's formed by two swing highs at the same level. A move through $72.50 support signals that the last contingent of buyers have gotten swatted out of this stock, and it's time to be a seller. This morning, WMT is perilously close to that $72.50 breakdown level. That said, don't consider this pattern triggered until WMT moves materially though it.
Support at $66 looks like a reasonable downside target for this stock. Investors looking for a bargain-priced entry in WMT should hold out for shares to hit $66 before trying to go long. For the time being, bears are stacked in this stock.
Cracker Barrel Old Country Store
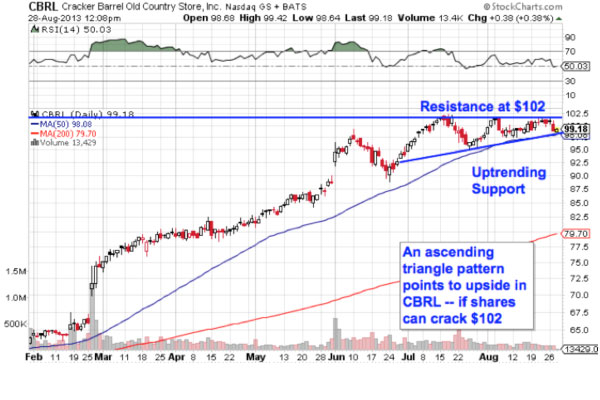
Things are looking a whole lot more promising for another chain based in the south, Cracker Barrel Old Country Store (CBRL). This small-cap restaurant stock has been on a tear in 2013, rallying more than 54% since the calendar flipped over to January. And now, a bullish price setup points to even more upside in the second half of the year.
CBRL is currently forming an ascending triangle pattern, a price setup formed by horizontal resistance above shares at $102, and uptrending support to the downside. Basically, as CBRL bounces in between those two technical price levels, it's getting squeezed closer and closer to a breakout above that $102 price ceiling. When that happens, it makes sense to be a buyer.
Whenever you're looking at any technical price pattern, it's critical to think in terms of buyers and sellers. Triangles, double tops, and other price pattern names are a good quick way to explain what's going on in this stock, but they're not the reason it's tradable. Instead, it all comes down to supply and demand for shares.
That resistance line at $102, for example, is a price where there is an excess of supply of shares; in other words, it's a place where sellers have been more eager to take recent gains and sell their shares than buyers are to buy. That's what makes the move above it so significant -- the breakout indicates that buyers are finally strong enough to absorb all of the excess supply above that price level.
The 50-day moving average has been a stellar proxy for support on the way up. I'd put a protective stop on the other side of it.
Tesoro Petroleum
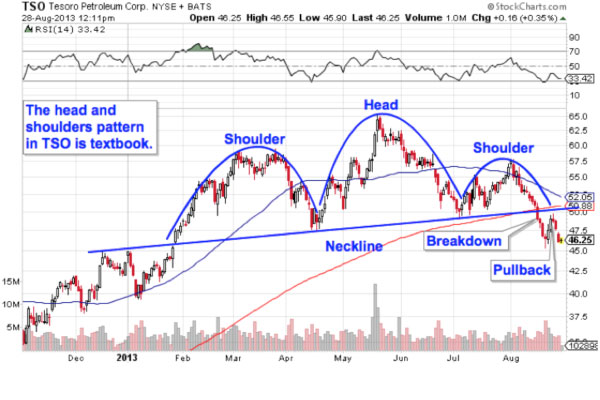
Last up is Tesoro Petroleum (TSO), a petroleum refiner that hasn't enjoyed the strength of its peers in recent weeks. In fact, this stock looks downright bearish right now, thanks to a textbook topping signal in shares. Here's how to trade it.
TSO is forming a head and shoulders top, a bearish reversal pattern that indicates exhaustion among buyers. The head and shoulders is formed by two swing highs that top out around the same level (the shoulders), separated by a bigger peak called the head; the sell signal comes on the breakdown below the pattern's "neckline" level, which was right at $50. The breakdown happened earlier this month.
But traders are getting a second chance for a low-risk entry in a TSO short. That's because this stock pulled back to retest newfound resistance at the neckline. Indeed, there's still plenty of downside room left in this name right now. This is a long-term setup with long-term trading implications.
To see this week's trades in action, check out this week's Must-See Charts portfolio on Stockpickr.
-- Written by Jonas Elmerraji in Baltimore.
No comments :
Post a Comment